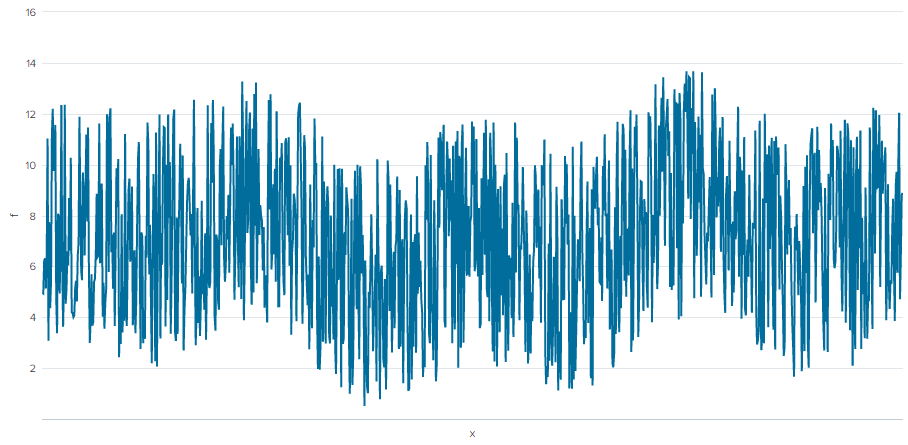
Sometimes you have line charts with multiple series displayed at once, and those lines are really ugly. The data they represent may be very volatile and make the chart difficult to see trends on. Take this single-series chart for example:

This is a simple line chart of some value f as it changes over x, which, in a time chart, is normally time. It is hard to see the shape of the underlying trend. Splunk has a solution for that called the trendline command. It’s simple to use and it calculates moving averages for series. If the data in our chart comprises a table with columns x and f, then we need only apply this to smooth out f:
| trendline sma20(f) AS f
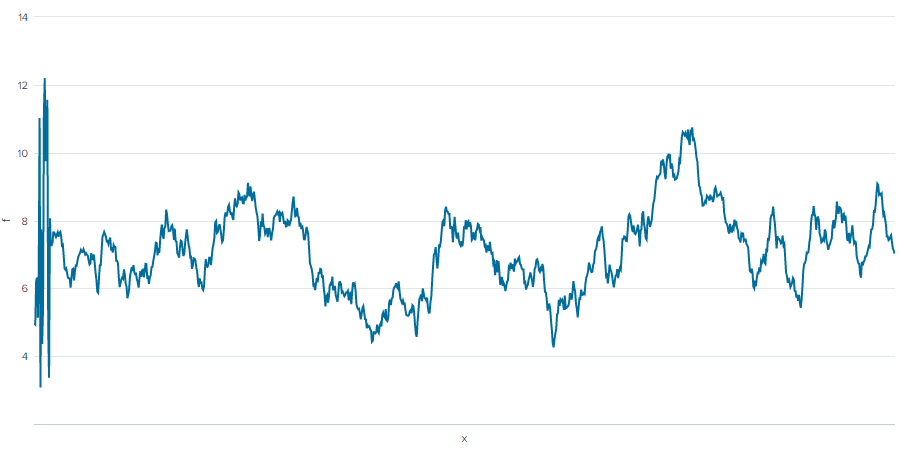
As a result, our volatile f is tamed to something much more discernable:

Switching to a moving average makes the trend more obvious and easier on the eyes than the jumble in the original chart. However, trendline has a significant limitation and the approach has an unfortunate weakness.
Smoothing without trendline
First, the limitation. You can only apply trendline to one series. It has no BY clause, so you cannot make multiple moving averages for several sets of data at once. Any chart with more than one series cannot use trendline. I have tried to get around this limitation by using map to handle each series separately and then combine them all, but that method performs a search for each iteration. If the chart is of twelve hosts, that is twelve searches through the data. If you have twelve such charts on your dashboard, 144 searches are needed to render the page.
Furthermore, the said weakness is obvious at the left side of the trend-lined graph. The turbulence in the data is not smoothed at the beginning of the graph because there are no data points to average when the sma function starts out. The smoothing does not start until Splunk has passed, in the case of sma20(), twenty data points and so we are left with that preliminary unsightliness.
Let us look at an example of a multi-series chart that can be improved by smoothing and consider a general-purpose method (1) to apply the smoothing to all series and (2) eliminate the initial noisiness inherent in trendline.
My example uses authentication event frequencies for five servers. You can modify the first line of this query to generate similarly course data, depending on what you have available in your environment.
tag=authentication host=web*
| timechart span=5min count BY host

My time span was for a full day, so we see data from midnight to midnight. Each data point is a five-minute interval. The lines are regularly punctuated by spikes and it is difficult to figure out what the trends are for the individual servers among all those swings in value.
First, consider the problem of smoothing the leading data without data points previous to the start of the time frame. Since this query does not generate those data points, we have to change it to fetch them — and get rid of them later. Since this should be a general-purpose method, it should accommodate changes to the time frame that we might apply, for example, with a dashboard time picker. Before continuing, we have to decide on a duration to use for the smoothing. I will use an hour in this example. If I were using trendline, the equivalent would be using the sma12() function on this data. But I have more than one series, so I will do it a different way here. I start by getting the extra hour of data before the beginning of my desired time span.
tag=authentication host=web*
[| makeresults
  | addinfo
  | eval latest = if(match(info_max_time, "\+Infinity"), info_search_time, info_max_time), earliest = max(info_min_time - 3600, 0)
  | table latest earliest
  | format "(" "(" "" ")" "OR" ")"]
| timechart span=5min count BY host
This odd sub-search (in yellow) adds earliest= and latest= clauses to the original search based on the time range set for the search. After adding an empty event with makeresults, the addinfo command adds fields with the time range selected for our search. The results we asked for should span from info_min_time up to, but not including, info_max_time. The eval takes into consideration some potential pathological values for these fields and fixes them appropriately, but, most importantly, it shifts the starting time back by 3,600 seconds — one hour, my chosen smoothing duration. Finally, the two limits for the time range are formatted and appended to the original search. The result is the same as the earlier search, except that now the data start at 23:00 on the previous day instead of midnight:

We can now say goodbye to timechart because we need to keep the data un-tabled for a while before making it graphable.
tag=authentication host=web*
[| makeresults
| addinfo
| eval latest = if(match(info_max_time, "\+Infinity"), info_search_time, info_max_time), earliest = max(info_min_time - 3600, 0)
| table latest earliest
| format "(" "(" "" ")" "OR" ")"]
| bin _time span=5min
| stats count BY _time host
| streamstats global=false window=12 mean(count) AS count BY host
| xyseries _time host count
Instead of doing it the easy way with timechart, we bin the events into five-minute buckets and use stats to calculate the counts per interval per host. When stats is done, the resulting table has columns for _time, host and count. Now, we can apply a moving average to the series by host to get independently smoothed series using the streamstats command. Note that the window size is twelve (12 five-minute intervals is an hour), and the global flag is off, so that each host’s series is averaged independently. When that is done, xyseries converts the statistics to tabular form for graphing.

That looks a lot different from the initial graph. But there is still the leading data that we did not ask for at the start of the chart. Let us drop that now with a where command:
tag=authentication host=web*
[| makeresults
| addinfo
| eval latest = if(match(info_max_time, "\+Infinity"), info_search_time, info_max_time), earliest = max(info_min_time - 3600, 0)
| table latest earliest
| format "(" "(" "" ")" "OR" ")"]
| bin _time span=5min
| stats count BY _time host
| streamstats global=false window=12 mean(count) AS count BY host
| addinfo
| where _time >= info_min_time + 3600
| xyseries _time host count
Another addinfo? The metadata added by addinfo in the sub-search is gone — indeed, it never modified the main search at all, except indirectly — and we need to know what the current time range is. Since the sub-search changed the time range of the main search, this iteration of addinfo actually reports the modified time range, not the range we specified in the time picker. The where simply removes the leading hour of data and we are left with the time range we originally asked for:

But wait! Not smooth enough, you say? I feel the same way. If one streamstats was good, adding second one is sure to be better:
tag=authentication host=web*
[| makeresults
| addinfo
| eval latest = if(match(info_max_time, "\+Infinity"), info_search_time, info_max_time), earliest = max(info_min_time - 3600, 0)
| table latest earliest
| format "(" "(" "" ")" "OR" ")"]
| bin _time span=5min
| stats count BY _time host
| streamstats global=false window=6 mean(count) AS count BY host
| streamstats global=false window=12 mean(count) AS count BY host
| addinfo
| where _time >= info_min_time + 3600
| xyseries _time host count
I put in a streamstats pass with a window of six data points before the streamstats that uses a 12-point window, but you can use two 12-point windows instead. Look at the results and choose what you prefer. I find that doing an average with a smaller number and then doing it for the whole window produces a curve that reacts better to the original variations, but is still smooth.

Nice.
Generalization and an mstats Warning
This code should work for event searches in general. I use it in dashboards and it can work well with base searches if you leave the data un-tabled and do the rest of the work in the post-search. Searches using metrics are different, but only slightly, and need a simple adjustment.
When you use the sub-search as I describe above to change the time range inside an mstats (metrics) search, the time range of the overall search context does not change like it does with an event search. You get the extra hour at the front, like you wanted, but when you run addinfo in the main search, the times returned are what you set using the time picker. This is not a problem if you adjust the where condition to apply to min_info_time instead of one hour hence, since min_info_time is still what was selected in the time picker. Exempli gratia:
| where _time >= info_min_time