Sequential Reads

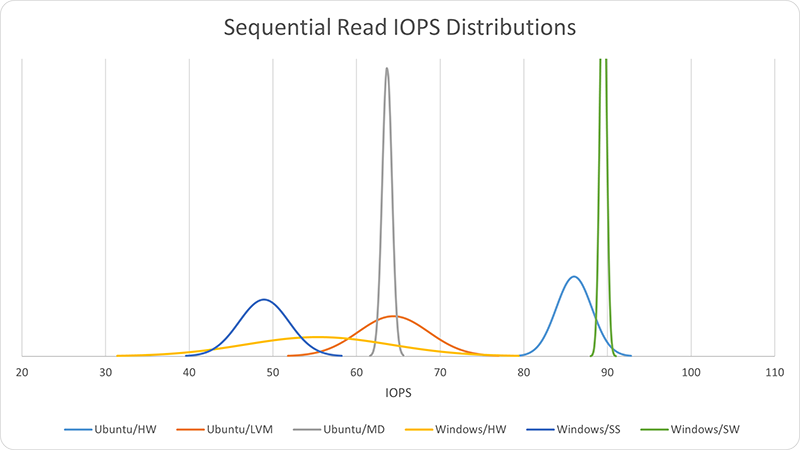
Unexpectedly, Windows software RAID performance (89.5 IOPS) lead the sequential read tests by a significant margin and was exceptionally invariant — the top of the distribution was cut on purpose for this graph because it was so steep. Ubuntu hardware RAID came in second (86 IOPS), but Windows hardware RAID was way behind (55.4 IOPS) and had a much higher variance (s=8.73) than any other result. The only thing worse than Windows hardware RAID was Windows Storage Spaces (48.9 IOPS, only 55% of the lead score).
| I/O Method | IOPS | s | MB/s |
|---|---|---|---|
| Ubuntu/HW | 86.0 | 2.13 | 360.7 |
| Ubuntu/LVM | 64.4 | 4.22 | 270.1 |
| Ubuntu/MD | 63.7 | 0.59 | 267.0 |
| Windows/HW | 55.4 | 8.73 | 232.3 |
| Windows/SS | 48.9 | 2.99 | 205.2 |
| Windows/SW | 89.5 | 0.39 | 375.4 |
Sequential Write

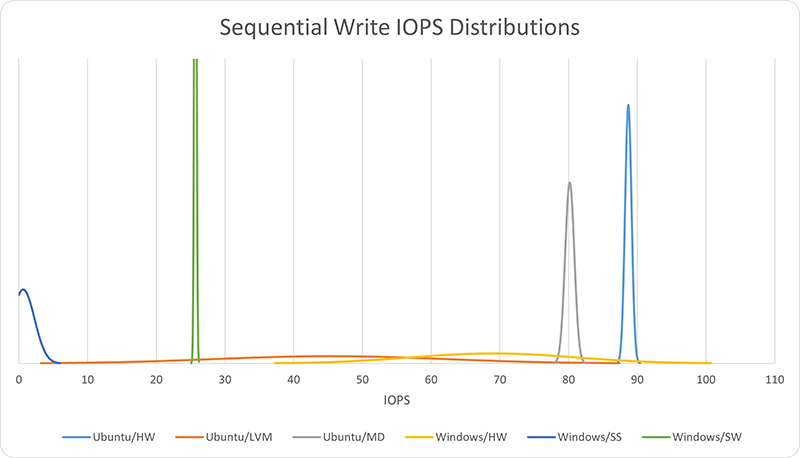
Ubuntu hardware RAID took the lead with sequential writes (88.7 IOPS), with both Ubuntu mdadm and Windows hardware RAID (80.2 and 69 IOPS, respectively) showing comparable performance. Windows hardware RAID, however, shows a much higher variance in performance, exceeded only by Ubuntu LVM, which came in next with only 45.3 IOPS and s=16.75. Windows software RAID was well behind that with 25.7 IOPS. But the poorest performer was Windows Storage Spaces with a mere 0.6 IOPS, less than 1% of the lead score.
| I/O Method | IOPS | s | MB/s |
|---|---|---|---|
| Ubuntu/HW | 88.7 | 0.47 | 372.0 |
| Ubuntu/LVM | 45.3 | 16.75 | 190.0 |
| Ubuntu/MD | 80.2 | 0.67 | 336.2 |
| Windows/HW | 69.0 | 11.99 | 289.5 |
| Windows/SS | 0.6 | 1.64 | 2.7 |
| Windows/SW | 25.7 | 0.15 | 107.7 |
The IOPS data is not the end of the story, however. Let us consider a summary of the IOPS results and compare that to CPU utilization data.